United States presidential election in Minnesota, 1968
| | ||||||||||||||||||||||||||||||||
| ||||||||||||||||||||||||||||||||
| ||||||||||||||||||||||||||||||||
|
| ||||||||||||||||||||||||||||||||
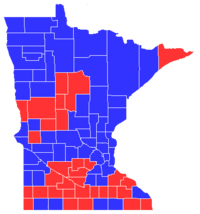
| County Results | ||||||||||||||||||||||||||||||||
| ||||||||||||||||||||||||||||||||
The 1968 United States presidential election in Minnesota took place on November 5, 1968 in Minnesota as part of the 1968 United States presidential election.
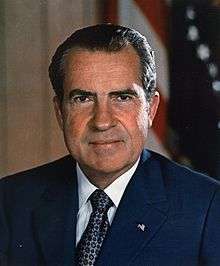
The Democratic Party candidate, incumbent Vice President Hubert Humphrey, the home-state favorite, won the state over former Vice President Richard Nixon by 199,095 votes, giving him one of his fourteen victories in the election.
The American Independent Party candidate, former Alabama governor George Wallace, failed to make a substantial impact in Minnesota, as his base of support was primarily in the Deep South. While Wallace took 13.5% of the national popular vote and won five states of the former Confederacy, he only took 4.43% of the vote in Minnesota, his weakest state in the Midwestern United States.
Nationally, Nixon won the election with 301 electoral votes, though he led Humphrey by less than a percent in the popular vote. The election permanently disrupted the New Deal Coalition, which had been dominant in presidential politics since 1932.
As of 2016, this is the last presidential election in Minnesota where any candidate won a county with over 70% of the popular vote. In this case, Humphrey won the following counties over this threshold: Carlton County, Lake County, and Saint Louis County.
Results
| United States presidential election in Minnesota, 1968[1] | |||||
|---|---|---|---|---|---|
| Party | Candidate | Votes | Percentage | Electoral votes | |
| Democratic | Hubert Humphrey | 857,738 | 54.00% | 10 | |
| Republican | Richard Nixon | 658,643 | 41.46% | 0 | |
| American Independent | George Wallace | 68,931 | 4.43% | 0 | |
| Peace and Freedom | Eldridge Cleaver | 935 | 0.06% | 0 | |
| Socialist Workers | Fred Halstead | 808 | 0.05% | 0 | |
| No party | Eugene McCarthy (write-in) | 585 | 0.04% | 0 | |
| Communist | Charlene Mitchell | 415 | 0.03% | 0 | |
| Socialist Labor | Henning Blomen | 285 | 0.02% | 0 | |
| Write-ins | Write-ins | 170 | 0.01% | 0 | |
| Totals | 1,599,655 | 100.00% | 10 | ||
| Voter turnout | 74% | — | |||
References
- ↑ "1968 Presidential Election Results, 1968". Dave Leip's U.S. Election Atlas. Retrieved 2016-10-03.


