Saint-Georges-de-Didonne
| Saint-Georges-de-Didonne | ||
|---|---|---|
|
| ||
| ||
 Saint-Georges-de-Didonne | ||
|
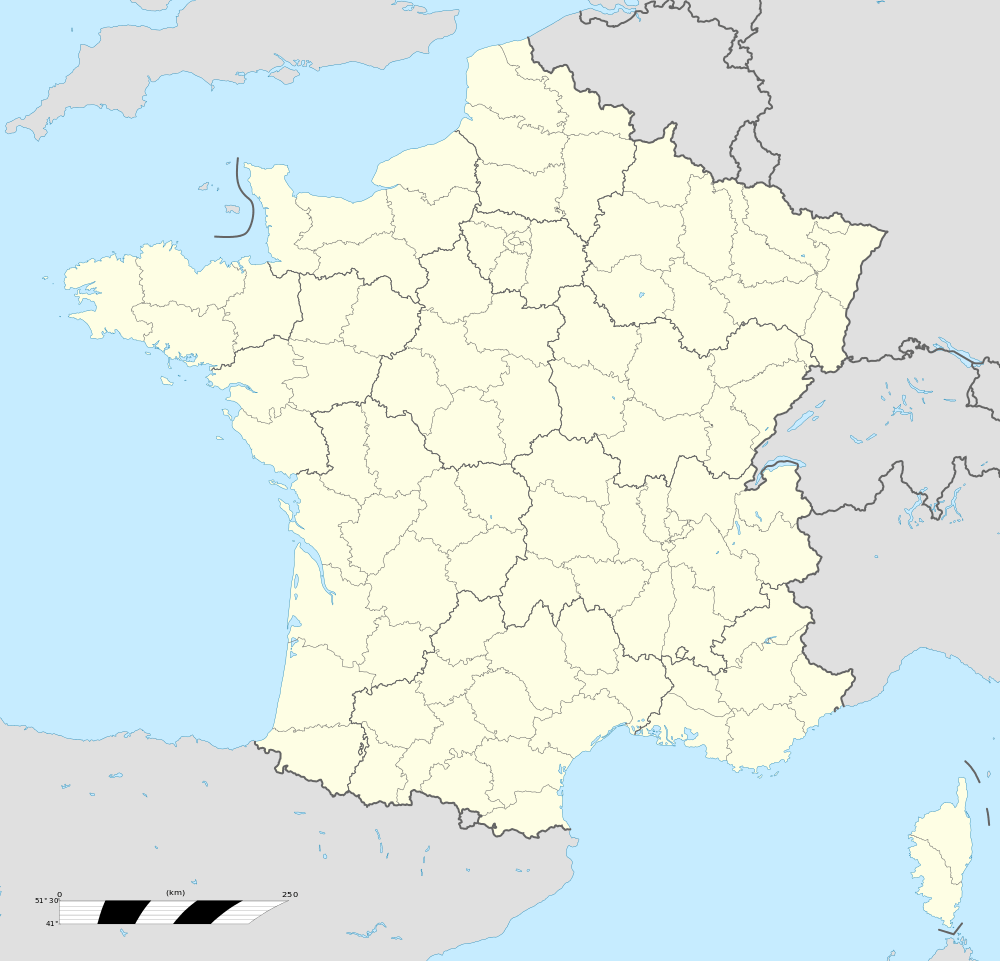
Location within Nouvelle-Aquitaine region  Saint-Georges-de-Didonne | ||
| Coordinates: 45°36′20″N 0°59′55″W / 45.6056°N 0.9986°WCoordinates: 45°36′20″N 0°59′55″W / 45.6056°N 0.9986°W | ||
| Country | France | |
| Region | Nouvelle-Aquitaine | |
| Department | Charente-Maritime | |
| Arrondissement | Rochefort | |
| Canton | Royan-Est | |
| Intercommunality | Royan Atlantique | |
| Government | ||
| • Mayor (2009–2014) | Françoise Brouard | |
| Area1 | 10.58 km2 (4.08 sq mi) | |
| Population (2008)2 | 5,039 | |
| • Density | 480/km2 (1,200/sq mi) | |
| Time zone | CET (UTC+1) | |
| • Summer (DST) | CEST (UTC+2) | |
| INSEE/Postal code | 17331 / 17110 | |
| Elevation |
0–45 m (0–148 ft) (avg. 15 m or 49 ft) | |
| Website | ||
|
1 French Land Register data, which excludes lakes, ponds, glaciers > 1 km² (0.386 sq mi or 247 acres) and river estuaries. 2 Population without double counting: residents of multiple communes (e.g., students and military personnel) only counted once. | ||
Saint-Georges-de-Didonne is a commune in the Charente-Maritime department and Nouvelle-Aquitaine region in southwestern France. And important seaside resort of Royan and the coast of Beauty, on the right bank of the mouth of the Gironde estuary and adjacent Atlantic Ocean, Saint-Georges-de-Didonne is a major economic and tourist centers of royannaise metropolitan city which it is now becoming a residential suburb. It has a population of 5,086 inhabitants (2011) - to over 50,000 people during the summer season - the heart of a community of agglomeration Royan Atlantique with 79 441 inhabitants (2011)
Population
| Historical population | ||
|---|---|---|
| Year | Pop. | ±% |
| 1793 | 697 | — |
| 1800 | 702 | +0.7% |
| 1806 | 632 | −10.0% |
| 1821 | 768 | +21.5% |
| 1831 | 808 | +5.2% |
| 1836 | 909 | +12.5% |
| 1841 | 934 | +2.8% |
| 1846 | 905 | −3.1% |
| 1851 | 884 | −2.3% |
| 1856 | 905 | +2.4% |
| 1861 | 920 | +1.7% |
| 1866 | 964 | +4.8% |
| 1872 | 972 | +0.8% |
| 1876 | 1,081 | +11.2% |
| 1881 | 1,127 | +4.3% |
| 1886 | 1,251 | +11.0% |
| 1891 | 1,211 | −3.2% |
| 1896 | 1,355 | +11.9% |
| 1901 | 1,409 | +4.0% |
| 1906 | 1,454 | +3.2% |
| 1911 | 1,541 | +6.0% |
| 1921 | 1,522 | −1.2% |
| 1926 | 1,782 | +17.1% |
| 1931 | 1,743 | −2.2% |
| 1936 | 2,004 | +15.0% |
| 1946 | 2,626 | +31.0% |
| 1954 | 3,391 | +29.1% |
| 1962 | 3,388 | −0.1% |
| 1968 | 3,680 | +8.6% |
| 1975 | 3,983 | +8.2% |
| 1982 | 4,287 | +7.6% |
| 1990 | 4,705 | +9.8% |
| 1999 | 5,034 | +7.0% |
| 2008 | 5,039 | +0.1% |
See also
References

Saint George's church
| Wikimedia Commons has media related to Saint-Georges-de-Didonne. |
This article is issued from Wikipedia - version of the 7/11/2016. The text is available under the Creative Commons Attribution/Share Alike but additional terms may apply for the media files.
