Castile and León parliamentary election, 1995
Castile and León parliamentary election, 1995

|
|
|
|
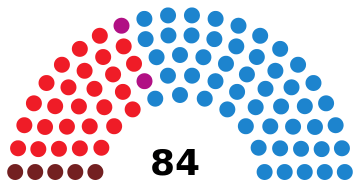
All 84 seats in the Courts of Castile and León
43 seats needed for a majority |
| Registered |
2,080,227  0.5% 0.5% |
| Turnout |
1,548,209 (74.4%)
6.8 pp |
| |
First party |
Second party |
| |
.jpg) |
.jpg) |
| Leader |
Juan José Lucas |
Jesús Quijano |
| Party |
PP |
PSOE |
| Leader since |
12 December 1990 |
26 May 1990 |
| Last election |
43 seats, 43.5% |
35 seats, 36.4% |
| Seats won |
50 |
27 |
| Seat change |
7 |
 8 8 |
| Popular vote |
802,493 |
454,198 |
| Percentage |
52.3% |
29.6% |
| Swing |
8.8 pp |
6.8 pp |
|
| |
Third party |
Fourth party |
| |
 |
 |
| Leader |
José Antonio Herreros |
Conchi Farto |
| Party |
IU |
UPL |
| Leader since |
1991 |
1995 |
| Last election |
1 seat, 5.4% |
0 seats, 0.8% |
| Seats won |
5 |
2 |
| Seat change |
4 |
2 |
| Popular vote |
147,366 |
39,201 |
| Percentage |
9.6% |
2.6% |
| Swing |
4.2 pp |
1.8 pp |
|
|
|
The 1995 Castile and León parliamentary election was held on Sunday, 28 May 1995, to elect the 4th Courts of Castile and León, the regional legislature of the Spanish autonomous community of Castile and León. At stake were all 84 seats in the Courts, determining the President of the Junta of Castile and León.
Electoral system
The number of seats in the regional Courts was determined by the population count. For the 1995 election, the Courts size was set to 84 seats. All Courts members were elected in 9 multi-member districts, corresponding to Castile and León's nine provinces, using the D'Hondt method and a closed-list proportional representation system. Each district was entitled to an initial minimum of 3 seats, with 1 additional seat per each 45,000 inhabitants or fraction greater than 22,500. For the 1995 election, seats were distributed as follows: Avila (7), Burgos (11), Leon (15), Palencia (7), Salamanca (11), Segovia (6), Soria (5), Valladolid (14) and Zamora (8).
Voting was on the basis of universal suffrage in a secret ballot. Only lists polling above 3% of valid votes in each district (which include blank ballots—for none of the above) were entitled to enter the seat distribution.[1]
Results
Overall
← Summary of the 28 May 1995 Castile and León Courts election results →
| |
| Party |
Vote |
Seats |
| Votes |
% |
±pp |
Won |
+/− |
|
People's Party (PP) |
802,493 | 52.30 | 8.79 |
50 | 7 |
|
Spanish Socialist Workers' Party (PSOE) |
454,198 | 29.60 | 6.84 |
27 | 8 |
|
United Left (IU) |
147,366 | 9.60 | 4.24 |
5 | 4 |
|
Leonese People's Union (UPL) |
39,201 | 2.55 | 1.72 |
2 | 2 |
|
Communal Land-Castilian Nationalist Party (TC-PNC) |
9,415 | 0.61 | 0.47 |
0 | ±0 |
|
Independent Solution (SI) |
9,087 | 0.59 | New |
0 | ±0 |
|
Avila Independent Group (AIAV) |
8,135 | 0.53 | New |
0 | ±0 |
|
El Bierzo Party (PB) |
6,553 | 0.43 | 0.11 |
0 | ±0 |
|
Regionalist Unity of Castile and León (URCL) |
6,308 | 0.41 | 0.39 |
0 | ±0 |
|
Spain Independents' Platform (PIE) |
4,646 | 0.30 | New |
0 | ±0 |
|
People's Palentine Group (APP) |
4,058 | 0.26 | New |
0 | ±0 |
|
Regionalist Party of the Leonese Country (PREPAL) |
3,465 | 0.23 | 0.08 |
0 | ±0 |
|
Independents for Leon (IPL) |
3,284 | 0.21 | New |
0 | ±0 |
|
Valladolid Independent Candidate (CIV) |
2,162 | 0.14 | New |
0 | ±0 |
|
Blank ballots |
28,290 | 1.84 | 0.18 |
|
| |
| Total |
1,534,489 | 100.00 | |
84 | ±0 |
| |
| Valid votes |
1,534,489 | 99.11 | 0.04 |
|
| Invalid votes |
13,720 | 0.89 | 0.04 |
| Votes cast / turnout |
1,548,209 | 74.43 | 6.86 |
| Abstentions |
532,018 | 25.57 | 6.86 |
| Registered voters |
2,080,227 | |
| |
| Source: Argos Information Portal |
| Vote share |
|---|
|
|
|
|
|
| PP |
|
52.30% |
| PSOE |
|
29.60% |
| IU |
|
9.60% |
| UPL |
|
2.55% |
| Others |
|
4.10% |
| Blank ballots |
|
1.84% |
| Parliamentary seats |
|---|
|
|
|
|
|
| PP |
|
59.52% |
| PSOE |
|
32.14% |
| IU |
|
5.95% |
| UPL |
|
2.38% |
References