Barking and Dagenham London Borough Council election, 2006
| |||||||||||||||||||||||||||||||||||||||||||||||
| |||||||||||||||||||||||||||||||||||||||||||||||
| |||||||||||||||||||||||||||||||||||||||||||||||

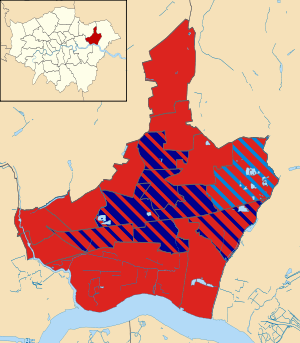
Map of the results of the 2006 Barking and Dagenham council election. Labour in red, British National Party in dark blue and Conservatives in blue.
Elections for Barking and Dagenham London Borough Council were held on Thursday 4 May 2006. The whole council was up for election. Barking and Dagenham is split up into 17 wards, each electing 3 councillors, so a total of 51 seats are up for election.
The Labour Party retained control of the council winning 38 seats and 56% of the popular vote. The BNP won 12 seats and formed the official opposition winning 14% of the popular vote. The Conservatives won 1 seat.
Election results
| Barking and Dagenham Local Election Result 2006 | ||||||||||
|---|---|---|---|---|---|---|---|---|---|---|
| Party | Seats | Gains | Losses | Net gain/loss | Seats % | Votes % | Votes | +/− | ||
| Labour | 38 | 0 | 4 | –5 | 74.5 | 56.0 | 58,377 | -6.8% | ||
| BNP | 12 | 12 | 0 | +12 | 23.5 | 14.2 | 14,789 | N/A | ||
| Conservative | 1 | 0 | 2 | –2 | 2.0 | 15.7 | 16,398 | +5.3% | ||
| UKIP | 0 | 0 | 0 | ±0 | 0.0 | 8.9 | 9,284 | N/A | ||
| Green | 0 | 0 | 0 | ±0 | 0.0 | 1.7 | 1,730 | +1.2% | ||
| Liberal Democrat | 0 | 0 | 3 | –3 | 0.0 | 1.3 | 1,392 | -18.4% | ||
| Independent | 0 | 0 | 0 | ±0 | 0.0 | 2.3 | 2,353 | N/A | ||
Total number of valid votes cast: 104,323
Ward results

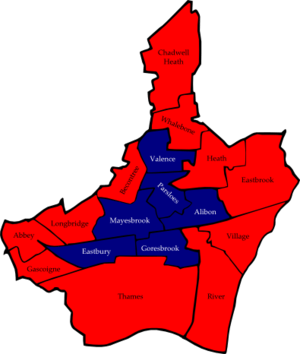
Map of the results of the 2006 Barking and Dagenham council election with ward names. Coloured by party which topped the poll in each ward. Labour in red and British National Party in dark blue.
| Party | Candidate | Votes | % | ± | |
|---|---|---|---|---|---|
| Labour | Jeanne Alexander | 1,367 | 64.3 | ||
| Labour | Mohammed Fani | 1,275 | |||
| Labour | Graham Bramley | 1,241 | |||
| Conservative | Foyzur Rahman | 765 | 35.7 | ||
| Party | Candidate | Votes | % | ± | |
|---|---|---|---|---|---|
| BNP | William Bailey | 1,329 | 41.7 | ||
| BNP | Claire Doncaster | 1,323 | |||
| Labour | John Davis | 1,071 | 33.6 | ||
| Labour | Terry Wade | 1,018 | |||
| Labour | Dave Miles | 957 | |||
| UKIP | Margaret Whitson | 394 | 12.4 | ||
| Conservative | Lucy East | 393 | 12.3 | ||
| Party | Candidate | Votes | % | ± | |
|---|---|---|---|---|---|
| Labour | Alok Agrawal | 1,268 | 47.3 | ||
| Labour | Evelyn Carpenter | 1,240 | |||
| Labour | Emmanuel Obasohan | 1,058 | |||
| UKIP | Daphne Jordon | 749 | 28.1 | ||
| Conservative | Claire Barker | 653 | 24.5 | ||
| Conservative | Malcolm Barker | 607 | |||
| Party | Candidate | Votes | % | ± | |
|---|---|---|---|---|---|
| Labour | Sarah Baillie | 1,101 | 37.7 | ||
| Labour | Nadine Smith | 999 | |||
| Labour | Shaun Carroll | 987 | |||
| Conservative | Terry Justice | 873 | 29.9 | ||
| Conservative | Maire Justice | 734 | |||
| Conservative | Sharron Chytry | 583 | |||
| Independent | Ronald Curtis | 560 | 19.2 | ||
| UKIP | Doreen Tucker | 385 | 13.2 | ||
| UKIP | Ronald Long | 376 | |||
| Party | Candidate | Votes | % | ± | |
|---|---|---|---|---|---|
| Labour | Mick McCarthy | 1,151 | 50.3 | ||
| Conservative | Neil Connelly | 1,139 | 49.7 | ||
| Labour | Bob Little | 1,126 | |||
| Conservative | Sue Connelly | 1,101 | |||
| Conservative | Susan Smith | 1,067 | |||
| Labour | Margaret Mullane | 1,036 | |||
| Party | Candidate | Votes | % | ± | |
|---|---|---|---|---|---|
| BNP | Jeffrey Steed | 1,102 | 32.4 | ||
| Labour | James McDermott | 965 | 28.4 | ||
| Labour | Patricia Northover | 944 | |||
| Labour | Hardial Rai | 852 | |||
| UKIP | Patrick Manley | 546 | 16.1 | ||
| Liberal Democrat | Diane Challis | 523 | 15.4 | ||
| UKIP | Ashley McIlroy | 455 | |||
| Liberal Democrat | Ryan Edwards | 451 | |||
| UKIP | Dorien McIlroy | 425 | |||
| Green | Geoff Sheridan | 260 | 7.7 | ||
| Liberal Democrat | Claire Stepton | 131 | |||
| Party | Candidate | Votes | % | ± | |
|---|---|---|---|---|---|
| Labour | Kathleen Flint | 1,579 | 58.8 | ||
| Labour | Milton McKenzie | 1,346 | |||
| Labour | Valerie Rush | 1,278 | |||
| Conservative | Alison Grey | 586 | 21.8 | ||
| Green | Hidir Yildirim | 522 | 19.4 | ||
| Party | Candidate | Votes | % | ± | |
|---|---|---|---|---|---|
| BNP | Richard Barnbrook | 1,434 | 42.4 | ||
| BNP | Tracy Lansdown | 1,357 | |||
| Labour | Warren Northover | 1,204 | 35.6 | ||
| Labour | Edna Fergus | 1,162 | |||
| Labour | Jeffrey Porter | 1,135 | |||
| Conservative | George Naylor | 373 | 11.0 | ||
| UKIP | Terence Jones | 367 | 10.9 | ||
| Party | Candidate | Votes | % | ± | |
|---|---|---|---|---|---|
| Labour | Charles Fairbrass | 1,293 | 48.6 | ||
| Labour | Linda Reason | 1,282 | |||
| Labour | Sidney Kallar | 1,229 | |||
| UKIP | Christine Smith | 790 | 29.7 | ||
| Conservative | Harry East | 579 | 21.8 | ||
| Conservative | Margaret White | 535 | |||
| Party | Candidate | Votes | % | ± | |
|---|---|---|---|---|---|
| Labour | Sukhninder Gill | 1,272 | 26.2 | ||
| Labour | Nirmal Gill | 1,253 | |||
| Labour | Gerald Vincent | 1,233 | |||
| Conservative | Brian Cook | 1,227 | 25.2 | ||
| Conservative | Margaret Cook | 1,111 | |||
| Independent | Anthony Richards | 1,072 | 22.1 | ||
| Conservative | Anthony Chytry | 910 | |||
| UKIP | James Burchill | 701 | 14.4 | ||
| Green | Laurence Cleeland | 588 | 12.1 | ||
| Party | Candidate | Votes | % | ± | |
|---|---|---|---|---|---|
| BNP | Robert Buckley | 1,145 | 38.4 | ||
| BNP | Christine Knight | 1,070 | |||
| Labour | Dee Hunt | 845 | 28.4 | ||
| UKIP | Vivian Patten | 741 | 24.9 | ||
| UKIP | Kerry Smith | 733 | |||
| UKIP | John Bolton | 697 | |||
| Labour | Dominic Twomey | 695 | |||
| Labour | Ahmed Choudhury | 679 | |||
| Conservative | Christopher Newton | 249 | 8.4 | ||
| Party | Candidate | Votes | % | ± | |
|---|---|---|---|---|---|
| BNP | Ronald Doncaster | 1,120 | 43.2 | ||
| BNP | Darren Tuffs | 1,052 | |||
| Labour | Herbert Collins | 1,050 | 40.5 | ||
| Labour | Frederick Jones | 1,026 | |||
| Labour | Catherine Osborn | 948 | |||
| UKIP | Peter Compobassi | 423 | 16.3 | ||
| Party | Candidate | Votes | % | ± | |
|---|---|---|---|---|---|
| Labour | Liam Smith | 1,529 | 50.9 | ||
| Labour | Patricia Twomey | 1,406 | |||
| Labour | Inder Jamu | 1,304 | |||
| UKIP | Betty Parsons | 858 | 28.6 | ||
| Conservative | Herbert White | 617 | 20.5 | ||
| Party | Candidate | Votes | % | ± | |
|---|---|---|---|---|---|
| Labour | Fred Barns | 1,264 | 51.5 | ||
| Labour | Joan Rawlinson | 1,157 | |||
| Labour | Barry Poulton | 1,127 | |||
| Independent | John Dias-Broughton | 721 | 29.4 | ||
| Conservative | Thomas Grey | 470 | 19.1 | ||
| Party | Candidate | Votes | % | ± | |
|---|---|---|---|---|---|
| BNP | Sandra Doncaster | 1,219 | 40.3 | ||
| BNP | Lawrence Rustem | 1,203 | |||
| Labour | Donald Hemmett | 1,071 | 35.4 | ||
| Labour | Dennis O'Brien | 1,005 | |||
| Labour | Bryan Osborn | 915 | |||
| UKIP | Angela Lambart | 372 | 12.3 | ||
| Green | Maria Sentivani | 360 | 11.9 | ||
| Party | Candidate | Votes | % | ± | |
|---|---|---|---|---|---|
| Labour | Philip Waker | 1,276 | 37.2 | ||
| Labour | Lee Waker | 1,269 | |||
| BNP | Jamie Jarvis | 1,227 | 35.8 | ||
| Labour | Bill Dale | 1,209 | |||
| BNP | James Webb | 1,208 | |||
| Conservative | Kenneth Coombs | 370 | 10.8 | ||
| Liberal Democrat | Fredrick Tindling | 287 | 8.4 | ||
| UKIP | Leslie Parsons | 272 | 7.9 | ||
| Party | Candidate | Votes | % | ± | |
|---|---|---|---|---|---|
| Labour | John Denyer | 1,304 | 56.1 | ||
| Labour | Marie West | 1,208 | |||
| Labour | John White | 1,159 | |||
| Conservative | Paul Taylor | 1,021 | 43.9 | ||
| Conservative | Christine Naylor | 1,014 | |||
External links
This article is issued from Wikipedia - version of the 10/27/2016. The text is available under the Creative Commons Attribution/Share Alike but additional terms may apply for the media files.