Water supply and sanitation in Japan
| Japan: Water and Sanitation | ||
|---|---|---|
 | ||
| Data | ||
| Access to an improved water source | 100%[1] | |
| Access to improved sanitation | 100% | |
| Continuity of supply | Continuous | |
| Average urban water use (liter/capita/day) | 314 (2006) including hotels and public baths[2] | |
| Average urban water and sewer tariff (US$/m3) | 2.46 in 2006 (1.33 for water and 1.13 for sewerage)[2] | |
| Share of household metering | 100% | |
| Share of collected wastewater treated | 100% [2] | |
| Non-revenue water | 7.3% (2007)[3] | |
| Annual investment in WSS | n/a | |
| Share of self-financing by utilities | high | |
| Share of tax-financing | low | |
| Share of external financing | none | |
| Institutions | ||
| Decentralization to municipalities | Yes | |
| National water and sanitation company | Japan Water Agency (bulk water supplier) | |
| Water and sanitation regulator | No | |
| Responsibility for policy setting | Ministry of Health, Labor and Welfare (water supply); Ministry of Land, Infrastructure, Transport and Tourism (sanitation) | |
| Sector law | Water Supply Law of 1957; Sewerage Law of 1958 (with subsequent amendments)[2] | |
| Number of service providers | 2,334 in 2006 (water); 3,699 in 2005 (sanitation)[2] | |
Water supply and sanitation in Japan is characterized by numerous achievements and some challenges. The country has achieved universal access to water supply and sanitation; has one of the lowest levels of water distribution losses in the world; regularly exceeds its own strict standards for the quality of drinking water and treated waste water; uses an effective national system of performance benchmarking for water and sanitation utilities; makes extensive use of both advanced and appropriate technologies such as the jōkasō on-site sanitation system; and has pioneered the payment for ecosystem services before the term was even coined internationally. Some of the challenges are a decreasing population, declining investment, fiscal constraints, ageing facilities, an ageing workforce, a fragmentation of service provision among thousands of municipal utilities, and the vulnerability of parts of the country to droughts that are expected to become more frequent due to climate change.
Access and service quality
Access to an improved water source is universal in Japan. 97% of the population receives piped water supply from public utilities and 3% receive water from their own wells or unregulated small systems, mainly in rural areas.[4]
Access to improved sanitation is also universal, either through sewers or on-site sanitation. All collected waste water is treated at secondary-level treatment plants. All effluents discharged to closed or semi-closed water bodies, such as Tokyo Bay, Osaka Bay, or Lake Biwa, are further treated to tertiary level. This applies to about 15% of waste water. The effluent quality is remarkably good at 3–10 mg/l of BOD for secondary-level treatment, well below the national effluent standard of 20 mg/l.[2]
Water resources and the use of water
Water resources and climate change
While Japan is not a water-stressed country per se, water availability varies substantially between years, seasons and regions leading to regular and serious water shortages. On average over the period 1971-2000, water resources in Japan stood at 420 km3 per year. At 3,300m3 per capita this is below the global average. On the Pacific coast where most Japanese live, 70-80% of rainfall occurs during only four months, i.e. the summer monsoon from June to July and the typhoon season from August to September. On the coast of the Sea of Japan the winter monsoon brings heavy snowfall from December to February.[5] National droughts occur about every 10 years in Japan, in addition to more frequent regional droughts. During the drought in 1994 the piped water supply of 16 million people had to be restricted. It is expected that the severity of droughts will increase because of climate change which will reduce the amount of water stored in the form of snow, increase evaporation from reservoirs and reduce rainfall.[6] Most of the water for domestic use comes from surface water. About 45% of the total comes from reservoirs regulated by dams, while 27% comes directly from rivers, 1% from lakes and 4% from river beds, totaling 77% from surface water. 23% of domestic water supply comes from groundwater, which is over-exploited in parts of the country.[7]

Water storage
While there are more than 2,500 dams in Japan, their total storage is low because rivers are short and steep. Total active storage of all dams is only 20 km3, corresponding to less than the storage capacity of Hoover dam.[8] In addition, lakes have an important storage function and their water levels are regulated through weirs. The largest lake is Lake Biwa that provides drinking water to more than 15 million people in the Keihanshin (Kyoto-Osaka-Kobe) metropolitan region.
Water use

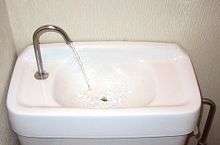
Water use is about 83.5 km3, or 20% of water availability in an average year. However, there are large variations in the utilization rate between years and regions. For example, in the coastal part of the Kantō region that includes Tokyo the utilization rate is over 90% in a dry year. In the relatively dry north of Kyushu it is more than 50%.[9] Of the total use 55.2 km3 was for agriculture, 16.2 km3 for domestic use and 12.1 km3 for industrial use.[6] Despite the introduction of water-saving devices domestic per capita use declined only slightly from 322 liter per capita per day in 2000 to 314 in 2004.[9] Per capita water use thus is slightly lower than in the United States (371 liter in 2005) and more than twice as high as in Germany (122 liter in 2007) or in England (145 liter in 2009).
Water quality
Although drinking water quality and the quality of waste water discharged into open watercourses typically exceed national standards, water quality in rivers and lakes still does not meet environmental standards. For example, the attainment rate of environmental standards was 87% in 2005, but in lakes and marshes it was only 50%.[10]
Infrastructure and technology
Water supply
New water distribution pipes are typically made from ductile iron and service pipes from stainless steel. The share of pipes made of these materials increased from 40% for ductile iron and zero for stainless steel in 1980 to 100% for both in 2006. The change in pipe materials is credited as a major factor in reducing water losses to one of the world's lowest levels.[3] Water treatment is usually through rapid sand filtration (76%), while 20% of water utilities only disinfect water without additional treatment. Utilities increasingly adopt advanced water treatment methods such as activated carbon, ozone disinfection and air stripping.[11]
Sanitation
Concerning sewerage, out of 1,896 systems, 1,873 were separate sewer systems (between sanitary sewers and stormwater sewers) and only 23 were combined sewer systems. In 2002 about 75 million people were connected to sewers and 35 million people had their waste water treated through small-scale waste water treatment devices called jōkasōs. They are common in areas not connected to sewers, but also exist in areas connected to sewers. There is even a specific jōkasō law that regulates their construction, installation, inspection and desludging. Jōkasōs use different technologies and serve different sizes of buildings from single-family homes to high-rise buildings, public or commercial buildings. Treated water can be easily reused for various purposes such as toilet flushing, watering gardens or car washing. Sludge from jōkasōs can be used as fertilizer. The government has a program to subsidize the installation of jōkasōs.[12] It has been attempted to transfer the technology to China and Indonesia.[13]
History

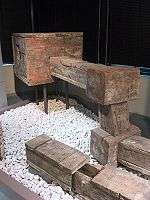
Prior to the Meiji period drinking water in Japan was fetched mainly from springs and traditional shallow wells. However, there were also some piped water supply systems using wooden pipes.
The first modern piped water system in Japan was completed in 1887 in the port city Yokohama, using surface water treated by a sand filter. By 1900, seven cities had piped water supply and by 1940 about one third of the population was connected to piped water systems. The incidence of water-borne diseases such as cholera, dysentery and typhoid remained high until after the Second World War when disinfection was introduced by the Americans and became mandatory in 1957. Through the increase of piped water supply, disinfection and sanitation the incidence of waterborne diseases dropped sharply during the 1960s and 70s.[14]
In the early 1960s, Tokyo faced a chronic water shortage and water supply to about 1 million households had to be cut around the time of the 1964 Summer Olympics. At the time, people used to call the city the "Tokyo Desert".

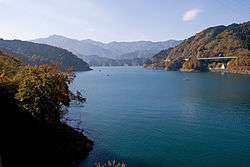
In 1961, a Water Resources Development Promotion Law was passed. On its basis over the next decade seven river basins with high growth in water needs were designated for water resources development and investments in dams, weirs and inter-basin transfers was undertaken on the basis of comprehensive development plans for each basin.[15] During the 1970s and 80s numerous dams were thus built to provide storage to avoid future water scarcity and to supply the growing cities with sufficient water. However, the construction of some dams was substantially delayed. For example, construction of the dam forming what is today Lake Miyagase was begun in 1971, but for a number of reasons including the need to resettle 300 households, the dam was only completed in 2000.[16] Beginning in the 1960s investment in waste water treatment was initiated. In 1993 the Environmental Law was passed and subsequently legislation was passed to protect the headwaters of rivers, thus gradually shifting from a curative approach to a preventative approach of water quality management.[17]
Responsibility for water supply and sanitation
Policy and regulation
Within the government the responsibility for regulating the water and sanitation sector is shared between the Ministry of Health, Labor and Welfare in charge of water supply for domestic use; the Ministry of Land, Infrastructure, Transport and Tourism in charge of water resources development as well as sanitation; the Ministry of the Environment in charge of ambient water quality and environmental preservation; and the Ministry of Internal Affairs and Communications in charge of performance benchmarking of utilities.
In 2004, the Ministry of Health, Labour and Welfare presented a Waterworks Vision "to show a map towards future goals shared among stakeholders of water supply services". The paper lists a number of challenges such as decreasing population, declining investment, ageing facilities and an ageing workforce. It also notes that current anti-earthquake measures are insufficient, some rivers are vulnerable to frequent drought and that facilities need to be better protected against terrorist attacks. The vision recommends a number of measures, including the introduction of "wide area water supply systems", an integrated approach to water quality management, to further promote earthquake-resistant construction, to increase energy efficiency and the use of alternative energies, to further reduce water leakage and to review the subsidy system "without charging higher water rates".[18]
Water resources development and bulk water supply
The Japan Water Agency (JWA) under the Ministry of Land, Infrastructure, Transport and Tourism constructs dams, estuary barrages, facilities for lake and marsh development, and canals. It also operates and maintains these facilities, supplying bulk water to other entities, such as utilities, that distribute it to end users. JWA was created by law in 2003 to succeed the Water Resources Development Public Corporation (WARDEC) that had been created in 1962.[19]
Service provision
Typically drinking water and sewage services are provided by different entities. In 2007 there were 1,572 water utilities and 3,699 sewage utilities in Japan. The number of sewage utilities is higher than the number of municipalities, which was only 1,804 down from 3,232 in 1999. The higher number of utilities may be because the merger of utilities lagged behind the merger of municipalities. Utilities can be either companies operating under commercial principles, subject to the Local Public Enterprise Law, or departments of local government subject to the government accounting system. Most water utilities but only few sewer utilities (213) are commercially operated companies. Only in a few cities, such as in Kyoto, drinking water and sewer services are provided by the same entity.[2] There are also 102 bulk water supply entities, which are often departments of Prefectures (such as in Osaka), specific water supply authorities (such as in Kanagawa) or associations of municipalities.[20]
Efficiency
Non-revenue water
Average non-revenue water was 7.3% in 2007, varying from less than 5% up to 15%. The low level of water leakage, down from 18% in 1978, has been achieved through speedy repairs that are typically undertaken the same day that a connection is reported, and through the use of high-quality pipe materials. The government's target is to reduce losses to 2% for large utilities and 5% for small utilities.[3] Japan is perhaps the only country in the world that also collects nationwide data on unaccounted for sewage, i.e. the amount of water that erroneously enters the sanitary sewer system e.g. through connections from stormwater sewers or groundwater leakage. The average unaccounted for sewerage is 12%, varying from 6% in Shiga to 30% in Sapporo.
Labor productivity
The number of employees per 1,000 connections is low in international comparison: It is 1.19 for water utilities and 0.62 for sewer utilities, totaling 1.81. It varies between 1.1 in Fukuoka to 2.5 in Kyoto.[2] This is an indicator of high labor productivity. One reason why the figure is low is that activities such as routine operation and maintenance as well as metering and billing are often outsourced. The level of the indicator would be higher and labor productivity would be lower if outsourced employees had been included in the above figures.
Performance benchmarking
Japan has a national performance benchmarking system for water supply and sanitation utilities that operate under the Local Public Enterprise Law.
Financial aspects
Cost recovery
Japan has a policy of full cost recovery for drinking water and sanitary sewers through tariffs. Stormwater management is considered a public good and is thus financed through general tax revenue and not through water and sewer tariffs. The accounting systems in place clearly distinguish between the two types of expenses, even in systems with combined sewers. The working ratio (share of operating costs in total revenues) averages 49% for water utilities and 67% for sewer utilities, indicating a healthy surplus available for depreciation of assets, debt service and self-financed investments. The cost recovery ratio is 97% for drinking water and 53% for sewerage.
Tariffs and affordability
The average water tariff was equivalent to US$1.33/m3 for water and US$1.13/m3 for sewerage in 2006.[2] Because of Japan's negative inflation rate during some years (e.g. between 2003 and 2006) real tariffs increase even if nominal tariffs remain unchanged. Utilities cannot raise tariffs themselves, but have to receive approval for tariff increases from municipal councils. The combined water and sewerage bill amounts to about 1% of household income and is thus considered affordable.
Financing
Investments are financed through bonds issued directly by the municipalities or utility bonds that are backed by municipalities; utilities' own resources; subsidies from the national government (e.g. grants of at least 50% for sanitation); and subsidies from municipalities. Investment subsidies are common for sanitation and uncommon for water supply. Private financing remains the exception.
Payments for ecosystem services
Since the 1970s Osaka prefecture has paid the equivalent of more than US$500 million for sustainable forest management around Lake Biwa, which is the source of the Yodo River that supplies Osaka with drinking water.[21] This is one of the earliest applications of the payments for ecosystem services concept and was implemented long before this English term became widely used.
References
- ↑ World Health Organization; UNICEF. "Joint Monitoring Program". Retrieved 2010-12-28.
World Health Organization; UNICEF (2010). "Joint Monitoring Programme for Water Supply and Sanitation. Coverage Estimates Improved Drinking Water.". - 1 2 3 4 5 6 7 8 9 Mohamed Benouahi and Satoru Ueda:Accountable Water and Sanitation Governance:Japan's Experience, in:Water in the Arab World. Management Perspectives and Innovations, World Bank, 2009, p. 131-156, retrieved on January 6, 2011
- 1 2 3 Ministry of Health, Labor and Welfare:Waterworks technologies in Japan, retrieved on January 6, 2011
- ↑ Ministry of Health, Labor and Welfare:Coverage, retrieved on January 6, 2011
- ↑ Food and Agriculture Organization (FAO) Aquastat:Japan country profile, Chapter on climate and water resources, 1997, retrieved on January 6, 2011
- 1 2 Ministry of Land, Infrastructure and Transport:Current state of water resources in Japan, ca. 2006, retrieved on January 6, 2011
- ↑ Ministry of Health, Labor and Welfare:Water Sources, retrieved on January 6, 2011
- ↑ Ministry of Land, Infrastructure and Transport:Water Resources Development, ca. 2006, retrieved on January 6, 2011
- 1 2 Ministry of Land, Infrastructure and Transport:Water balance in Japan, ca. 2006, retrieved on January 6, 2011
- ↑ Ministry of Land, Infrastructure and Transport:Issues on water resources, ca. 2006, retrieved on January 6, 2011
- ↑ Ministry of Health, Labor and Welfare:Types of Treatment Plants, retrieved on January 6, 2011
- ↑ Hiroshi Ogawa:Domestic Wastewater Treatment by Johkasou Systems in Japan, retrieved on January 6, 2011
- ↑ Motoyuki Mizuochi:Small-Scale Domestic Wastewater Treatment Technology in Japan, and the Possibility of Technological Transfer, Asian Environment Research Group, National Institute for Environmental Studies, Japan, retrieved on January 6, 2011
- ↑ Ministry of Health, Labor and Welfare:Development of Modern Waterworks, retrieved on January 6, 2011
- ↑ Japan Water Agency:History, retrieved on January 6, 2011
- ↑ Global Architects Guide:Miyagase Dam, retrieved on January 6, 2011
- ↑ Ministry of Land, Infrastructure and Transport:Water Resources of Japan. History of Water Use, retrieved on January 6, 2011
- ↑ Waterworks Vision Summary, June 2004, retrieved on January 6, 2011
- ↑ Japan Water Agency:JWA History, retrieved on January 6, 2011
- ↑ Ministry of Health, Labor and Welfare:Types of Water Supply Services, retrieved on January 6, 2011
- ↑ OECD:Environmental Performance Review Japan, Box2:Paying for Ecosystem Services - The Yodo River, 2010, retrieved on January 6, 2011
External links
| Wikimedia Commons has media related to Water supply in Japan. |
- Ministry of Health, Labor and Welfare: Water Supply in Japan
- Ministry of Land, Infrastructure, Transport and Tourism: Water Resources in Japan
ḏيوهلخšẓ