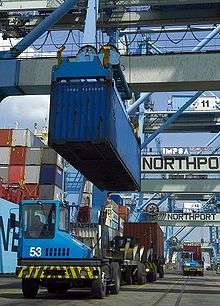
List of the largest trading partners of China
The figures do not include foreign direct investment, but only trade in goods and services.
Top trading partners with China
This list was released on January 10, 2014 and reflects the volume of trade in 2013.[1] Total trade values are in billions of USD.
| Rank | Trading Partner | Total trade |
|---|---|---|
| 1 | | 521 |
| 2 | | 312.55 |
| 3 | | 274.24 |
| 4 | | 197.28 |
| 5 | | 161.56 |
| 6 | | 136.37 |
| 7 | | 106.07 |
| 8 | | 90.27 |
| 9 | | 89.21 |
Notable changes compared to 2011 include India dropping out of the list and Malaysia joining the list at 8th place.
The largest Chinese partners in billions of US Dollars for 2011 are as follows:
| Region | Exports | Imports[2] | Total trade | Trade balance |
|---|---|---|---|---|
| | 356.0 | 211.2 | 567.2 | +144.8 |
| | 324.5 | 122.2 | 446.7 | +202.3 |
| | 268.0 | 15.5 | 283.5 | +252.5 |
| | 170.1 | 192.8 | 362.9 | -22.7 |
| | 148.3 | 194.6 | 342.9 | -46.3 |
| | 82.9 | 162.7 | 245.6 | -79.8 |
| | 31.8 | 52.4 | 84.2 | -20.6 |
| | 50.5 | 23.4 | 73.9 | +27.1 |
| | 38.9 | 40.3 | 79.2 | -1.4 |
| | 35.1 | 124.9 | 160.0 | -89.8 |
As of 2013 EU - Chinese trade makes the EU the largest trading partner of China and China the second largest trading partner of the EU.[3]
China is a dominant trading partner of many countries. The following tables are based on 2014 data as shown on the CIA World Factbook unless otherwise indicated. Some countries are repeated from the previous table.
See also
References
- ↑ "Top 10 trading partners of the Chinese mainland". China Daily. February 19, 2014.
- ↑ - National Bureau of Statistics of China - Statistical Communiqué on the 2011 National Economic and Social Development. National Bureau of Statistics of the People's Republic of China. February 22, 2012. Archived April 6, 2012, at the Wayback Machine.
- ↑ "Client and Supplier Countries of the EU28 in Merchandise Trade" European Commission. August 27, 2014.
- ↑ "Exports - partners". World Fact Book, Central Intelligence Agency. Retrieved October 10, 2015.
- ↑ "Imports - partners". World Fact Book, Central Intelligence Agency. Retrieved October 10, 2015.
