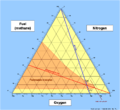
Flammability diagram

Flammability diagrams show the regimes of flammability in mixtures of fuel, oxygen and an inert gas, typically nitrogen. Mixtures of the three gasses are usually depicted in a triangular diagram, also known as a Ternary plot. Such diagrams are available in the speciality literature.[1][2][3] The same information can be depicted in a normal orthogonal diagram, showing only two substances, implicitly using that the sum of all three components are 100 percent. The diagrams below only concerns one fuel, the diagrams can be generalized to mixtures of fuels.
Understanding flammability diagrams
Triangular diagrams are not commonplace. The easiest way to understand them is to briefly go through three basic steps in their construction.
- Consider the first triangular diagram below, which shows all possible mixtures of methane, oxygen and nitrogen. Air is a mixture of about 21 volume percent oxygen, and 79 volume percent inerts (nitrogen). Any mixture of methane and air will therefore lie on the straight line between pure methane and pure air - this is shown as the blue air-line. The upper and lower flammability limits of methane in air are located on this line, as shown.
- The stoichiometric combustion of methane is: CH4 + 2O2 → CO2 + 2H2O. The stoichiometric concentration of methane in oxygen is therefore 1/(1+2), which is 33 percent. Any stoichiometric mixture of methane and oxygen will lie on the straight line between pure nitrogen (and zero percent methane) and 33 percent methane (and 67 percent oxygen) - this is shown as the red stoichiometric line. The upper and lower flammability limits of methane in oxygen are located on the methane axis, as shown.
- The actual envelope defining the flammability zone can only be determined based on experiments. The envelope will pass through the upper and lower flammability limits of methane in oxygen and in air, as shown. The nose of the envelope defines the limiting oxygen concentration (LOC)).
-

Triangular diagram showing all possible mixtures of methane, oxygen and nitrogen. Any mixture of methane and air will lie on the blue air-line
-

Any stoichiometric mixture of methane and oxygen will lie on the red stoichiometric line
-

The actual flammability envelope defining flammable mixtures of methane
-
.png)
Same diagram, but with alternative axis layout
Diagrams for multicomponent mixtures
(coming)
See also
Sources
- Zabetakis, Michael G. (1965). Flammability characteristics of combustible gases and vapors (Buletin 627). US Bureau of Mines, Wash., D.C. p. 129. (His main work, 6.3Mb download)
- Burgess, DS; Furno AL; Kuchta JM; Mura KE (1982). "Flammability of mixed gases". Report of Investigations. RI-8709.
- Mashuga, CV; Crowl DA (1998). "Application of the flammability diagram for evaluation of fire and explosion hazards of flammable vapors". Process Safety Progress. 17 (3): 176–183. doi:10.1002/prs.680170305.
- Crowl, Daniel A. (2003). Understanding Explosions. Wiley-AIChE. ISBN 0-8169-0779-X.
References
- ↑ for instance in Michael George Zabetakis' 1965 work, which remains one of the most widely cited sources of flammability data.
- ↑ Mashuga 1998
- ↑ Crowl 2003