Ohio's 12th congressional district
| Ohio's 12th congressional district | |
|---|---|
|
Ohio's 12th congressional district - since January 3, 2013. | |
| Current Representative | Pat Tiberi (R) |
| Distribution |
|
| Population (2010) | 738,859[1] |
| Median income | 63,046 |
| Ethnicity |
|
| Occupation | |
| Cook PVI | R+8 |
Ohio's 12th congressional district is represented by Republican (GOP) Representative Patrick J. Tiberi. The district includes communities north and east of Columbus including Zanesville, Mansfield and Dublin.
From 2003 to 2013 the district included the heavily African-American part of Ohio's capital city, Columbus, Ohio along with its northern suburbs, including Westerville, Ohio.
Historically it has been a safe seat for the GOP. Since 1920, it has been held by the GOP except for an eight-year stretch in the 1930s and a two-year term in 1980 where the Democratic Party held the seat; in both instances the Democratic incumbent was later defeated by a GOP politician. However, in the 2004 presidential election George W. Bush narrowly won the district against John Kerry, 51% to 49%.[2] In the 2008 presidential election, Democratic candidate Barack Obama won the 12th district by a margin of 53% to 46%.
List of representatives
| Representative | Party | Congress(es) | Year(s) | Notes |
|---|---|---|---|---|
| District created March 4, 1823 | ||||
 John Sloane John Sloane |
Adams-Clay D-R | 18th | March 4, 1823 – March 3, 1825 |
Redistricted from the 6th district |
| Adams | 19th–20th | March 4, 1825 – March 3, 1829 | ||
 John Thomson John Thomson |
Jacksonian | 21st–22nd | March 4, 1829 – March 3, 1833 |
Redistricted to the 17th district |
 Robert Mitchell Robert Mitchell |
23rd | March 4, 1833 – March 3, 1835 |
||
 Elias Howell Elias Howell |
Anti-Jacksonian | 24th | March 4, 1835 – March 3, 1837 |
|
 Alexander Harper Alexander Harper |
Whig | 25th | March 4, 1837 – March 3, 1839 |
|
_001.png) Jonathan Taylor Jonathan Taylor |
Democratic | 26th | March 4, 1839 – March 3, 1841 |
|
 Joshua Mathiot Joshua Mathiot |
Whig | 27th | March 4, 1841 – March 3, 1843 |
|
 Samuel Finley Vinton Samuel Finley Vinton |
28th–31st | March 4, 1843 – March 3, 1851 |
||
 John Welch John Welch |
32nd | March 4, 1851 – March 3, 1853 |
||
 Edson B. Olds Edson B. Olds |
Democratic | 33rd | March 4, 1853 – March 3, 1855 |
Redistricted from the 9th district |
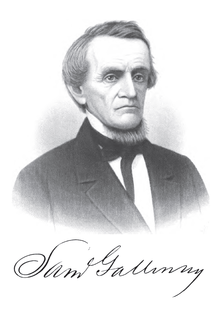 Samuel Galloway Samuel Galloway |
Opposition | 34th | March 4, 1855 – March 3, 1857 |
|
 Samuel S. Cox Samuel S. Cox |
Democratic | 35th–37th | March 4, 1857 – March 3, 1863 |
Redistricted to the 7th district |
 William E. Finck William E. Finck |
38th–39th | March 4, 1863 – March 3, 1867 |
||
 Philadelph Van Trump Philadelph Van Trump |
40th–42nd | March 4, 1867 – March 3, 1873 |
||
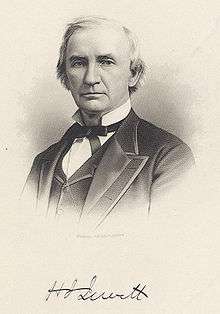 Hugh J. Jewett Hugh J. Jewett |
43rd | March 4, 1873 – June 23, 1874 |
Resigned to become President of the Erie Railroad | |
 William E. Finck William E. Finck |
43rd | December 7, 1874 – March 3, 1875 |
||
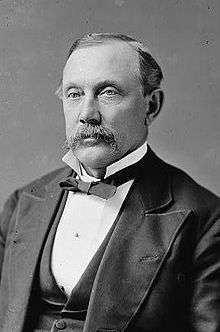 Ansel T. Walling Ansel T. Walling |
44th | March 4, 1875 – March 3, 1877 |
||
 Thomas Ewing, Jr. Thomas Ewing, Jr. |
45th | March 4, 1877 – March 3, 1879 |
Redistricted to the 10th district | |
 Henry S. Neal Henry S. Neal |
Republican | 46th | March 4, 1879 – March 3, 1881 |
Redistricted from the 11th district, Redistricted to the 11th district |
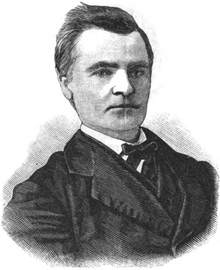 George L. Converse George L. Converse |
Democratic | 47th | March 4, 1881 – March 3, 1883 |
Redistricted from the 9th district, Redistricted to the 13th district |
 Alphonso Hart Alphonso Hart |
Republican | 48th | March 4, 1883 – March 3, 1885 |
|
 Albert C. Thompson Albert C. Thompson |
49th | March 4, 1885 – March 3, 1887 |
Redistricted to the 11th district | |
 Jacob J. Pugsley Jacob J. Pugsley |
50th–51st | March 4, 1887 – March 3, 1891 |
||
 William H. Enochs William H. Enochs |
52nd | March 4, 1891 – March 3, 1893 |
Redistricted to the 10th district | |
 Joseph H. Outhwaite Joseph H. Outhwaite |
Democratic | 53rd | March 4, 1893 – March 3, 1895 |
Redistricted from the 9th district |
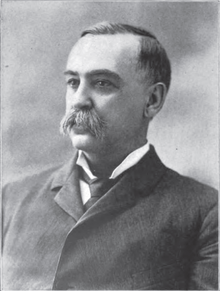 David K. Watson David K. Watson |
Republican | 54th | March 4, 1895 – March 3, 1897 |
|
 John J. Lentz John J. Lentz |
Democratic | 55th–56th | March 4, 1897 – March 3, 1901 |
|
 Emmett Tompkins Emmett Tompkins |
Republican | 57th | March 4, 1901 – March 3, 1903 |
|
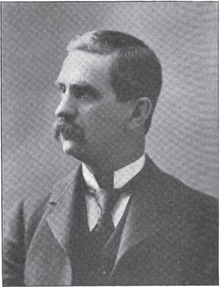 De Witt C. Badger De Witt C. Badger |
Democratic | 58th | March 4, 1903 – March 3, 1905 |
|
 Edward L. Taylor, Jr. Edward L. Taylor, Jr. |
Republican | 59th–62nd | March 4, 1905 – March 3, 1913 |
|
.png) Clement L. Brumbaugh Clement L. Brumbaugh |
Democratic | 63rd–66th | March 4, 1913 – March 3, 1921 |
|
 John C. Speaks John C. Speaks |
Republican | 67th–71st | March 4, 1921 – March 3, 1931 |
|
.jpg) Arthur P. Lamneck Arthur P. Lamneck |
Democratic | 72nd–75th | March 4, 1931 – January 3, 1939 |
|
 John M. Vorys John M. Vorys |
Republican | 76th–85th | January 3, 1939 – January 3, 1959 |
|
 Samuel L. Devine Samuel L. Devine |
86th–96th | January 3, 1959 – January 3, 1981 |
||
 Bob Shamansky Bob Shamansky |
Democratic | 97th | January 3, 1981 – January 3, 1983 |
|
 John Kasich John Kasich |
Republican | 98th–106th | January 3, 1983 – January 3, 2001 |
|
 Pat Tiberi Pat Tiberi |
107th– present |
January 3, 2001 – Present |
||
Election results
The following chart shows historic election results. Bold type indicates victor. Italic type indicates incumbent.
| Year | Democratic | Republican | Other |
|---|---|---|---|
| 2012[3] | Jim Reese: 134,614 | Patrick J. Tiberi: 233,874 | |
| 2010[4] | Paula Brooks: 110,307 | Patrick J. Tiberi: 150,163 | Travis Irvine (L): 8,710 |
| 2008[5] | David Robinson: 152,234 | Patrick J. Tiberi: 197,447 | Steven Linnabary (L): 10,707 |
| 2006 | Robert N. Shamansky: 126,573 | Patrick J. Tiberi: 198,723 | |
| 2004 | Edward S. Brown: 122,109 | Patrick J. Tiberi: 198,912 | |
| 2002 | Edward S. Brown: 64,707 | Patrick J. Tiberi: 116,982 | |
| 2000 | Maryellen O'Shaughnessy: 115,432 | Patrick J. Tiberi: 139,242 | Charles Ed Jordan: 1,566 Nick Hogan (L): 4,546 Gregory B. Richey (N): 2,600 |
| 1998 | Edward S. Brown: 60,694 | John R. Kasich: 124,197 | |
| 1996 | Cynthia L. Ruccia: 78,762 | John R. Kasich: 151,667 | Barbara Ann Edelman (N): 7,005 |
| 1994 | Cynthia L. Ruccia: 57,294 | John R. Kasich: 114,608 | |
| 1992 | Bob Fitrakis: 68,761 | John R. Kasich: 170,297 | |
| 1990 | Mike Gelpi: 50,784 | John R. Kasich: 130,495 | |
| 1988 | Mark P. Brown: 50,782 | John R. Kasich: 204,892 | |
| 1986 | Timothy C. Jochim: 42,727 | John R. Kasich: 117,905 | |
| 1984 | Richard S. Sloan: 65,215 | John R. Kasich: 148,899 | |
| 1982 | Robert N. Shamansky: 82,753 | John R. Kasich: 88,335 | Russell A. Lewis (L): 3,939 |
| 1980 | Robert N. Shamansky: 108,690 | Samuel L. Devine: 98,110 | |
| 1978 | James L. Baumann: 61,698 | Samuel L. Devine: 81,573 | |
| 1976 | Francine Ryan: 89,424 | Samuel L. Devine: 90,987 | William Roger "Bill" Moss (I): 15,429 |
| 1974 | Francine Ryan: 70,818 | Samuel L. Devine: 73,303 | |
| 1972 | James W. Goodrich: 81,074 | Samuel L. Devine: 103,655 | |
| 1970 | James W. Goodrich: 60,538 | Samuel L. Devine: 82,486 | |
| 1968 | Herbert J. Pfeifer: 51,202 | Samuel L. Devine: 106,664 | |
| 1966 | Robert N. Shamansky: 39,140 | Samuel L. Devine: 70,102 | |
| 1964 | Robert L. Van Heyde: 118,299 | Samuel L. Devine: 146,971 | |
| 1962 | Paul D. Cassidy: 60,563 | Samuel L. Devine: 130,316 | |
| 1960 | Richard E. Liming: 90,894 | Samuel L. Devine: 140,236 | |
| 1958 | Walter J. Shapter Jr.: 84,470 | Samuel L. Devine: 100,684 | |
| 1956 | Walter J. Shapter Jr.: 79,597 | John M. Vorys: 128,682 | |
| 1954 | Jacob F. Myers: 59,210 | John M. Vorys: 94,585 | |
| 1952 | George T. Tarbutton: 81,665 | John M. Vorys: 134,693 | |
| 1950 | John W. Guy: 65,860 | John M. Vorys: 117,396 | |
| 1948 | Robert M. Draper: 87,770 | John M. Vorys: 95,575 | |
| 1946 | Arthur P. Lamneck: 45,779 | John M. Vorys: 74,691 | |
| 1944 | Forrest F. Smith: 82,503 | John M. Vorys: 97,856 | |
| 1942 | Arthur P. Lamneck: 40,290 | John M. Vorys: 56,558 | |
| 1940 | Arthur P. Lamneck: 87,115 | John M. Vorys: 91,767 | |
| 1938 | Arthur P. Lamneck: 62,026 | Jonn M. Vorys: 64,409 | |
| 1936 | Arthur P. Lamneck: 88,222 | Grant P. Ward: 64,766 | |
| 1934 | Arthur P. Lamneck: 63,396 | John C. Speaks: 50,386 | |
| 1932 | Arthur P. Lamneck: 63,135 | John C. Speaks: 62,704 | |
| 1930 | Arthur P. Lamneck: 59,330 | John C. Speaks: 43,840 | |
| 1928 | Carl H. Valentine: 50,216 | John C. Speaks: 82,574 | |
| 1926 | H. S. Atkinson: 31,724 | John C. Speaks: 41,119 | |
| 1924 | Lowry F. Sater: 41,291 | John C. Speaks: 58,705 | |
| 1922 | H. Sage Valentine: 37,875 | John C. Speaks: 47,265 | William Garminden (SL): 632 |
| 1920 | Arthur P. Lamneck: 43,845 | John C. Speaks: 62,247 | Enoch B. Eubanks: 1,481 |
Historical district boundaries
See also
References
- ↑ "My Congressional District". United States Census Bureau. Retrieved 2013-03-05.
- ↑ "Presidential Results by Congressional District, 2000-2008". Swing State Project. 2008-12-15. Retrieved 2009-03-26.
- ↑ "2012 Election Results". Ohio Secretary of State.
- ↑ 2010 Election Results Archived copy at the Library of Congress (November 9, 2011)., Ohio Secretary of State, Retrieved 12/17/2010
- ↑ Federal Elections 2008. Federal Elections Commission, Washington DC, July 2009
- Martis, Kenneth C. (1989). The Historical Atlas of Political Parties in the United States Congress. New York: Macmillan Publishing Company.
- Martis, Kenneth C. (1982). The Historical Atlas of United States Congressional Districts. New York: Macmillan Publishing Company.
- Congressional Biographical Directory of the United States 1774–present
Coordinates: 40°14′22″N 82°36′49″W / 40.23944°N 82.61361°W
.tif.png)