Crewe (UK Parliament constituency)
| Crewe | |
|---|---|
|
Former County constituency for the House of Commons | |
| County | Cheshire |
| 1885–1983 | |
| Number of members | One |
| Replaced by | Crewe & Nantwich and Congleton |
Crewe was a constituency of the House of Commons of the Parliament of the United Kingdom from 1885 to 1983. It elected one Member of Parliament (MP) by the first past the post system of election.
The constituency was abolished for the 1983 general election in favour of Crewe and Nantwich, with some of the constituency moved into Congleton.
Boundaries
1885-1918: The Municipal Borough of Crewe, and parts of the Sessional Divisions of Nantwich and Northwich.
1918-1950: The Municipal Borough of Crewe, the Urban Districts of Alsager and Nantwich, and parts of the Rural Districts of Congleton and Nantwich.
1950-1955: The Municipal Borough of Crewe, the Urban District of Nantwich, and the Rural District of Nantwich.
1955-1983: The Municipal Borough of Crewe, the Urban Districts of Alsager and Sandbach, and in the Rural District of Nantwich the civil parishes of Barthomley, Crewe, Haslington, and Weston.
As its name suggested, the constituency was centred on the town of Crewe in Cheshire. The town of Nantwich was also included in the constituency until 1955, when it gained its own eponymous seat.
Members of Parliament
Elections
Elections in the 1880s
| Party | Candidate | Votes | % | ± | |
|---|---|---|---|---|---|
| Liberal | George William Latham | 5,089 | 54.3 | n/a | |
| Conservative | O L Stephen | 4,281 | 45.7 | n/a | |
| Majority | 808 | 8.6 | n/a | ||
| Turnout | n/a | ||||
| Liberal win (new seat) | |||||
| Party | Candidate | Votes | % | ± | |
|---|---|---|---|---|---|
| Liberal | Walter Stowe Bright McLaren | 4,690 | 53.7 | -0.6 | |
| Conservative | F R Twemlow | 4,045 | 46.3 | +0.6 | |
| Majority | 645 | 7.4 | -1.2 | ||
| Turnout | 80.8 | ||||
| Liberal hold | Swing | -0.6 | |||
Elections in the 1890s
| Party | Candidate | Votes | % | ± | |
|---|---|---|---|---|---|
| Liberal | Walter Stowe Bright McLaren | 5,558 | 58.2 | +4.5 | |
| Conservative | H W Chatterton | 3,990 | 41.8 | -4.5 | |
| Majority | 1,568 | 16.4 | +9.0 | ||
| Turnout | 83.7 | + | |||
| Liberal hold | Swing | +4.5 | |||
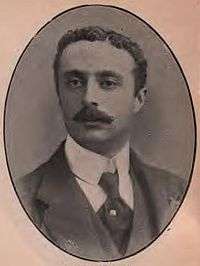
| Party | Candidate | Votes | % | ± | |
|---|---|---|---|---|---|
| Conservative | Hon. Robert Arthur Ward | 5,413 | 52.7 | +10.9 | |
| Liberal | Walter Stowe Bright McLaren | 4,863 | 47.3 | -10.9 | |
| Majority | 550 | 5.4 | 21.8 | ||
| Turnout | 85.5 | +1.8 | |||
| Conservative gain from Liberal | Swing | +10.9 | |||
Elections in the 1900s
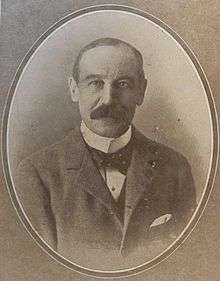
| Party | Candidate | Votes | % | ± | |
|---|---|---|---|---|---|
| Liberal | James Tomkinson | 6,120 | 55.4 | +8.1 | |
| Conservative | J E Reiss | 4,921 | 44.6 | -8.1 | |
| Majority | 1,199 | 10.8 | 16.2 | ||
| Turnout | 82.1 | ||||
| Liberal gain from Conservative | Swing | +8.1 | |||
| Party | Candidate | Votes | % | ± | |
|---|---|---|---|---|---|
| Liberal | James Tomkinson | 7,805 | 59.6 | +4.2 | |
| Conservative | James Hugh Welsford | 5,297 | 40.4 | -4.2 | |
| Majority | 2,508 | 19.2 | +8.4 | ||
| Turnout | 87.1 | +5.0 | |||
| Liberal hold | Swing | +4.2 | |||
Elections in the 1910s
| Party | Candidate | Votes | % | ± | |
|---|---|---|---|---|---|
| Liberal | Rt Hon. James Tomkinson | 7,761 | 53.3 | -6.3 | |
| Liberal Unionist | Sir John Lane Harrington | 5,419 | 37.2 | -3.2 | |
| Labour | Frank Herbert Rose | 1,380 | 9.5 | n/a | |
| Majority | 2,342 | 16.1 | -3.1 | ||
| Turnout | 91.8 | ||||
| Liberal hold | Swing | -1.5 | |||
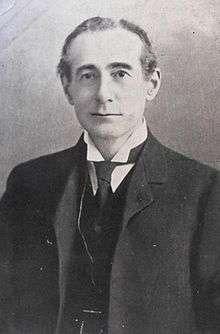
| Party | Candidate | Votes | % | ± | |
|---|---|---|---|---|---|
| Liberal | Walter Stowe Bright McLaren | 7,639 | 55.8 | +2.5 | |
| Conservative | James Hugh Welsford | 6,041 | 44.2 | +7.0 | |
| Majority | 1,598 | 11.6 | -4.5 | ||
| Turnout | 86.2 | ||||
| Liberal hold | Swing | -2.2 | |||
| Party | Candidate | Votes | % | ± | |
|---|---|---|---|---|---|
| Liberal | Walter Stowe Bright McLaren | 7,629 | 56.3 | +0.5 | |
| Liberal Unionist | Ernest Young Craig | 5,925 | 43.7 | -0.5 | |
| Majority | 1,704 | 12.6 | +1.0 | ||
| Turnout | 85.4 | ||||
| Liberal hold | Swing | +0.5 | |||
| Party | Candidate | Votes | % | ± | |
|---|---|---|---|---|---|
| Unionist | Ernest Young Craig | 6,260 | 44.6 | +0.9 | |
| Liberal | Harold Lawson Murphy | 5,294 | 37.7 | ||
| Labour | James Holmes | 2,485 | 17.7 | n/a | |
| Majority | |||||
| Turnout | |||||
| Unionist gain from Liberal | Swing | ||||
General Election 1914/15:
Another General Election was required to take place before the end of 1915. The political parties had been making preparations for an election to take place and by the July 1914, the following candidates had been selected;
- Unionist: Ernest Young Craig
- Liberal: Joseph Davies
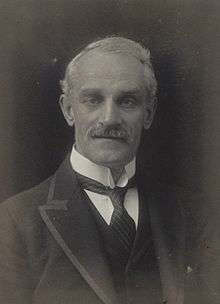
| Party | Candidate | Votes | % | ± | |
|---|---|---|---|---|---|
| Liberal | 13,392 | 56.2 | +18.5 | ||
| Labour | James Thomas Brownlie | 10,439 | 43.8 | +27.1 | |
| Majority | 2,953 | 12.4 | |||
| Turnout | 68.4 | ||||
| Liberal gain from Unionist | Swing | n/a | |||
- endorsed by the Coalition Government.
Elections in the 1920s

| Party | Candidate | Votes | % | ± | |
|---|---|---|---|---|---|
| Labour | Edward George Hemmerde | 15,311 | 50.9 | ||
| National Liberal | Sir Joseph Davies | 14,756 | 49.1 | ||
| Majority | 555 | 1.8 | |||
| Turnout | 80.9 | ||||
| Labour gain from Liberal | Swing | ||||
| Party | Candidate | Votes | % | ± | |
|---|---|---|---|---|---|
| Labour | Edward George Hemmerde | 14,628 | 46.5 | -4.4 | |
| Unionist | Sir Thomas Joseph Strangman | 8,734 | 27.8 | n/a | |
| Liberal | Robert Mortimer Montgomery | 8,068 | 25.7 | n/a | |
| Majority | 5,894 | 18.7 | |||
| Turnout | 82.8 | ||||
| Labour hold | Swing | n/a | |||
| Party | Candidate | Votes | % | ± | |
|---|---|---|---|---|---|
| Unionist | Ernest Young Craig | 18,333 | 55.5 | ||
| Labour | Edward George Hemmerde | 14,705 | 44.5 | ||
| Majority | 3,628 | 11.0 | |||
| Turnout | 85.6 | ||||
| Unionist gain from Labour | Swing | ||||
- Liberal candidate, Alexander Lyle-Samuel withdrew.
| Party | Candidate | Votes | % | ± | |
|---|---|---|---|---|---|
| Labour | John William Bowen | 20,948 | 50.2 | +5.7 | |
| Unionist | Donald Bradley Somervell | 11,732 | 28.1 | -27.4 | |
| Liberal | William Craven Llewelyn | 9,076 | 21.7 | n/a | |
| Majority | 9,216 | 22.1 | 33.1 | ||
| Turnout | 83.7 | -1.9 | |||
| Labour gain from Unionist | Swing | +16.5 | |||
Elections in the 1930s
| Party | Candidate | Votes | % | ± | |
|---|---|---|---|---|---|
| Conservative | Donald Bradley Somervell | 25,141 | 57.8 | ||
| Labour | John William Bowen | 18,351 | 42.2 | ||
| Majority | 6,790 | 15.6 | |||
| Turnout | 84.5 | ||||
| Conservative gain from Labour | Swing | ||||
| Party | Candidate | Votes | % | ± | |
|---|---|---|---|---|---|
| Conservative | Sir Donald Bradley Somervell | 21,729 | 51.3 | ||
| Labour | John William Bowen | 20,620 | 48.7 | ||
| Majority | 1,109 | 2.6 | |||
| Turnout | 80.3 | ||||
| Conservative hold | Swing | ||||
General Election 1939/40
Another General Election was required to take place before the end of 1940. The political parties had been making preparations for an election to take place and by the Autumn of 1939, the following candidates had been selected;
- Conservative: Sir Donald Bradley Somervell
- Labour: John William Bowen[17]
Elections in the 1940s
| Party | Candidate | Votes | % | ± | |
|---|---|---|---|---|---|
| Labour | Sydney Scholefield Allen | 28,416 | 60.6 | ||
| Conservative | Rt Hon. Sir Donald Bradley Somervell | 18,468 | 39.4 | ||
| Majority | 9,948 | 21.2 | |||
| Turnout | 74.6 | ||||
| Labour gain from Conservative | Swing | ||||
Elections in the 1950s
| Party | Candidate | Votes | % | ± | |
|---|---|---|---|---|---|
| Labour | Sydney Scholefield Allen | 28,981 | 53.3 | ||
| Conservative | Dr John Richard T. Turner | 25,355 | 46.7 | ||
| Majority | 3,626 | 6.7 | |||
| Turnout | 86.7 | ||||
| Labour hold | Swing | ||||
| Party | Candidate | Votes | % | ± | |
|---|---|---|---|---|---|
| Labour | Sydney Scholefield Allen | 28,488 | 52.2 | ||
| Conservative | Dr John Richard T. Turner | 26,045 | 47.8 | ||
| Majority | 2,443 | 4.5 | |||
| Turnout | 86.6 | ||||
| Labour hold | Swing | ||||
| Party | Candidate | Votes | % | ± | |
|---|---|---|---|---|---|
| Labour | Sydney Scholefield Allen | 21,629 | 52.5 | ||
| Conservative | Granger Farwell Boston | 15,273 | 37.1 | ||
| Liberal | Thomas Stuttard Rothwell | 4,306 | 10.5 | N/A | |
| Majority | 6,356 | 15.4 | |||
| Turnout | 81.5 | ||||
| Labour hold | Swing | ||||
| Party | Candidate | Votes | % | ± | |
|---|---|---|---|---|---|
| Labour | Sydney Scholefield Allen | 22,811 | 54.5 | ||
| Conservative | Geoffrey Leonard Beaman | 19,030 | 45.5 | ||
| Majority | 3,781 | 9.0 | |||
| Turnout | 82.1 | ||||
| Labour hold | Swing | ||||
Elections in the 1960s
| Party | Candidate | Votes | % | ± | |
|---|---|---|---|---|---|
| Labour | Sydney Scholefield Allen | 23,579 | 57.2 | ||
| Conservative | Anthony G. Barbour | 17,657 | 42.8 | ||
| Majority | 5,922 | 14.4 | |||
| Turnout | 79.0 | ||||
| Labour hold | Swing | ||||
| Party | Candidate | Votes | % | ± | |
|---|---|---|---|---|---|
| Labour | Sydney Scholefield Allen | 24,141 | 61.0 | ||
| Conservative | Anthony G. Barbour | 15,430 | 39.0 | ||
| Majority | 8,711 | 22.0 | |||
| Turnout | 75.6 | ||||
| Labour hold | Swing | ||||
Elections in the 1970s
| Party | Candidate | Votes | % | ± | |
|---|---|---|---|---|---|
| Labour | Sydney Scholefield Allen | 22,160 | 54.3 | ||
| Conservative | Alastair Robertson Goodlad | 18,678 | 45.7 | ||
| Majority | 3,482 | 8.5 | |||
| Turnout | 71.0 | ||||
| Labour hold | Swing | ||||
| Party | Candidate | Votes | % | ± | |
|---|---|---|---|---|---|
| Labour | Hon. Gwyneth Patricia Dunwoody | 21,259 | 46.5 | ||
| Conservative | James Graham Park | 16,136 | 35.3 | ||
| Liberal | D. J. Hulland | 8,313 | 18.2 | N/A | |
| Majority | 5,123 | 11.2 | |||
| Turnout | 77.8 | ||||
| Labour hold | Swing | ||||
| Party | Candidate | Votes | % | ± | |
|---|---|---|---|---|---|
| Labour | Hon. Gwyneth Patricia Dunwoody | 21,534 | 49.7 | ||
| Conservative | James Graham Park | 14,279 | 32.9 | ||
| Liberal | E.A. Richardson | 7,559 | 17.4 | ||
| Majority | 7,255 | 16.7 | |||
| Turnout | 73.2 | ||||
| Labour hold | Swing | ||||
| Party | Candidate | Votes | % | ± | |
|---|---|---|---|---|---|
| Labour | Hon. Gwyneth Patricia Dunwoody | 22,288 | 48.3 | ||
| Conservative | J. V. Butcher | 18,051 | 39.1 | ||
| Liberal | C. Bithell | 5,430 | 11.8 | ||
| National Front | W. Tonks | 352 | 0.8 | N/A | |
| Majority | 4,237 | 9.2 | |||
| Turnout | 77.5 | ||||
| Labour hold | Swing | ||||
References
- ↑ British parliamentary election results, 1885-1918 (Craig)
- ↑ British parliamentary election results, 1885-1918 (Craig)
- ↑ British parliamentary election results, 1885-1918 (Craig)
- ↑ British parliamentary election results, 1885-1918 (Craig)
- ↑ British parliamentary election results, 1885-1918 (Craig)
- ↑ British parliamentary election results, 1885-1918 (Craig)
- ↑ British parliamentary election results, 1885-1918 (Craig)
- ↑ British parliamentary election results, 1885-1918 (Craig)
- ↑ British parliamentary election results, 1885-1918 (Craig)
- ↑ British Parliamentary Election Results 1918-1949, FWS Craig
- ↑ British Parliamentary Election Results 1918-1949, FWS Craig
- ↑ British Parliamentary Election Results 1918-1949, FWS Craig
- ↑ British Parliamentary Election Results 1918-1949, FWS Craig
- ↑ British Parliamentary Election Results 1918-1949, FWS Craig
- ↑ British Parliamentary Election Results 1918-1949, FWS Craig
- ↑ British Parliamentary Election Results 1918-1949, FWS Craig
- ↑ Report of the Annual Conference of the Labour Party, 1939
- ↑ UK General Election results July 1945
- ↑ UK General Election results February 1950
- ↑ UK General Election results October 1951
- ↑ UK General Election results May 1955
- ↑ UK General Election results October 1959
- ↑ UK General Election results October 1964
- ↑ UK General Election results March 1966
- ↑ UK General Election results 1970
- ↑ UK General Election results February 1974
- ↑ UK General Election results October 1974
- ↑ UK General Election results May 1979